Premarket analysis › Thu, Oct 15, 2026
NQ, ES & Gold Premarket Analysis for Thu, Oct 15, 2026: Key Levels, Bias & Liquidity
Levels as of 8:45 AM New York time, before the cash open. NQ bearish, ES bearish, Gold bearish. Prior day and overnight levels, Asia and London ranges, unfilled gaps, buy-side and sell-side liquidity and reversal areas for NQ, ES & Gold futures, Thu, Oct 15, 2026.
- NQ: bias bearish, at 29,814.50; buy-side 29,941.00, sell-side 29,711.00.
- ES: bias bearish, at 7,746.50; buy-side 7,769.50, sell-side 7,728.75.
- Gold: bias bearish, at 4,167.1; buy-side 4,183.3, sell-side 4,132.0.
NQ premarket analysis (NQZ6)
Daily bias: Bearish
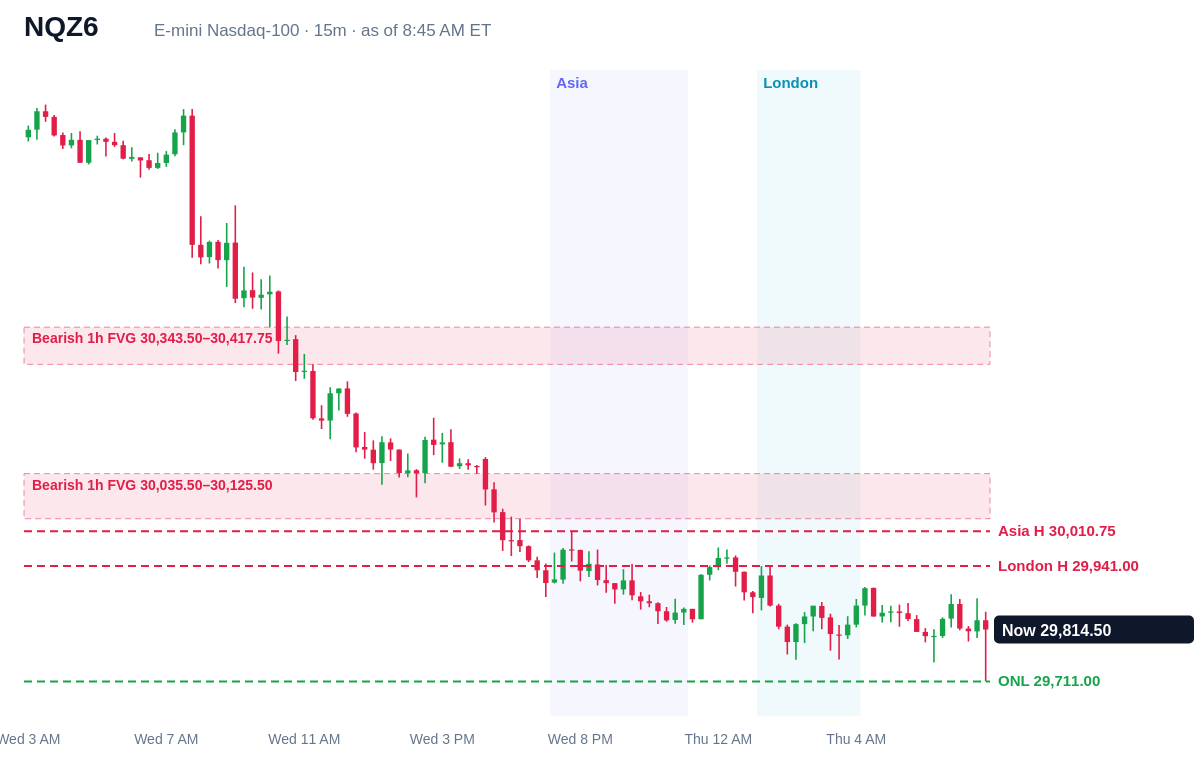
Bias leans bearish: yesterday closed below the prior day low, near the low of its range; the overnight is trading below yesterday's close. The nearest draw on liquidity in that direction is 29,711.00, the overnight low.
Wednesday's session
NQ opened Wednesday at 30,791.50, traded 30,078.00–30,891.50 (a 813.50 point range, wider than the 5-day average of 512.15) and closed at 30,139.25, -642.75 on the day and 8% of the way up its range. The regular session ran 30,078.00–30,660.75.
Overnight session
The overnight has traded 29,711.00–30,158.50 and is at 29,814.50 as of 8:45 AM ET. Asia ranged 29,823.50–30,010.75 and London 29,754.00–29,941.00. The overnight broke the prior day low at 30,078.00 and is holding beyond it.
Liquidity
Buy-side (above): 29,941.00 (London high), 30,010.75 (Asia high), 30,158.50 (overnight high), 30,891.50 (prior day high).
Sell-side (below): 29,711.00 (overnight low).
Gaps and key zones
- Bearish 1h FVG 30,035.50–30,125.50 (formed Wed 6 PM) above price
- Bearish 1h FVG 30,343.50–30,417.75 (formed Wed 11 AM) above price
- New day opening gap 30,139.25–30,154.75 (the last 5 PM close to the 6 PM reopen)
Reversal areas to watch
- Short reversal area: 29,941.00 to 30,035.50, where the London high is just under a bearish 1 hour gap. A failed sweep there is the short setup to watch.
- Short reversal area: 30,010.75 to 30,035.50, where the Asia high is just under a bearish 1 hour gap. A failed sweep there is the short setup to watch.
All key levels
| Level | Price | From now | |
|---|---|---|---|
| Prior week high | PWH | 31,616.50 | +1,802.00 |
| Prior day high | PDH | 30,891.50 | +1,077.00 |
| Prior week low | PWL | 30,792.00 | +977.50 |
| Prior day midpoint | PD EQ | 30,484.75 | +670.25 |
| Overnight high | ONH | 30,158.50 | +344.00 |
| Prior day close | PDC | 30,139.25 | +324.75 |
| Prior day low | PDL | 30,078.00 | +263.50 |
| Asia high | Asia H | 30,010.75 | +196.25 |
| London high | London H | 29,941.00 | +126.50 |
| Asia low | Asia L | 29,823.50 | +9.00 |
| London low | London L | 29,754.00 | -60.50 |
| Overnight low | ONL | 29,711.00 | -103.50 |
ES premarket analysis (ESZ6)
Daily bias: Bearish
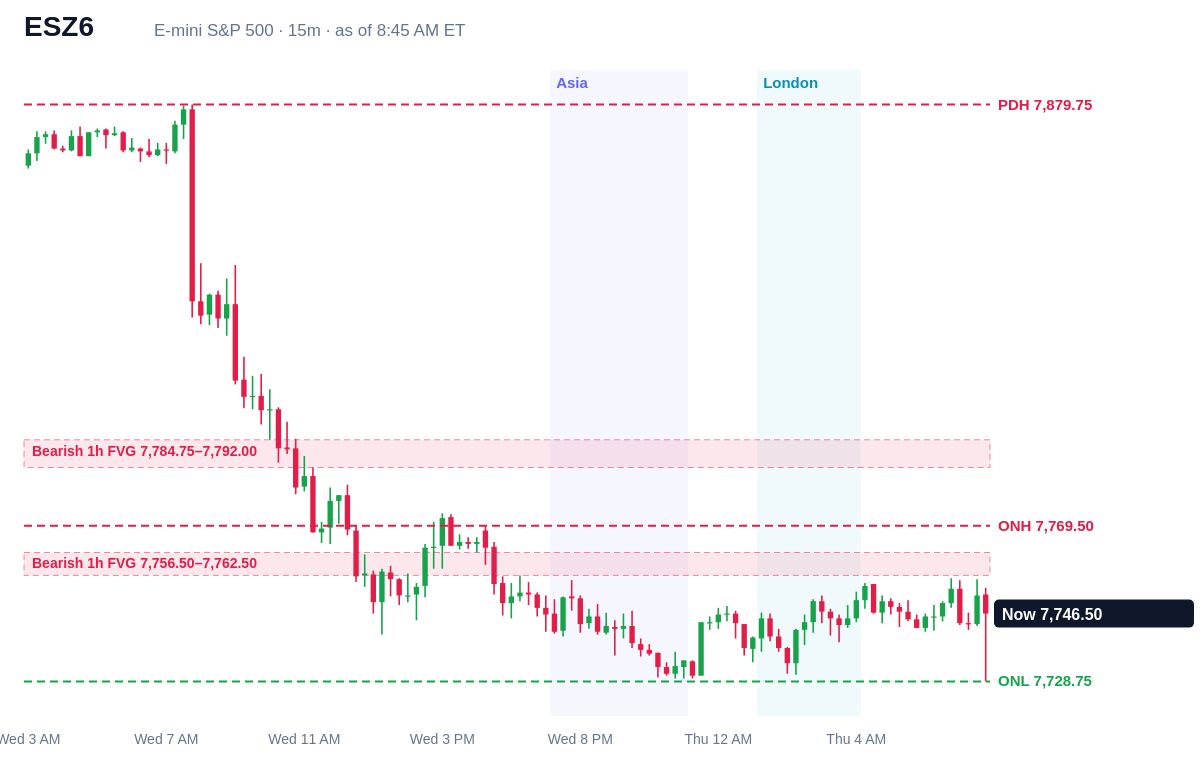
Bias leans bearish: yesterday closed below the prior day low, near the low of its range; the overnight is trading below yesterday's close and swept the prior day low and came back inside. The nearest draw on liquidity in that direction is 7,728.75, the overnight low.
Wednesday's session
ES opened Wednesday at 7,855.50, traded 7,741.00–7,879.75 (a 138.75 point range, wider than the 5-day average of 67.55) and closed at 7,765.25, -90.25 on the day and 17% of the way up its range. The regular session ran 7,741.00–7,837.75.
Overnight session
The overnight has traded 7,728.75–7,769.50 and is at 7,746.50 as of 8:45 AM ET. Asia ranged 7,729.50–7,755.25 and London 7,730.50–7,752.25. The overnight swept the prior day low at 7,741.00 and came back inside.
Liquidity
Buy-side (above): 7,769.50 (overnight high), 7,879.75 (prior day high), 7,897.50 (prior week high).
Sell-side (below): 7,728.75 (overnight low).
Gaps and key zones
- Bearish 1h FVG 7,756.50–7,762.50 (formed Wed 6 PM) above price
- Bearish 1h FVG 7,784.75–7,792.00 (formed Wed 11 AM) above price
- New day opening gap 7,765.25–7,768.25 (the last 5 PM close to the 6 PM reopen)
Reversal areas to watch
- Short reversal area: 7,769.50 to 7,784.75, where the overnight high is just under a bearish 1 hour gap. A failed sweep there is the short setup to watch.
- Short reversal area: 7,864.25 to 7,879.75, where the prior day high is just above a bearish 1 hour gap. A failed sweep there is the short setup to watch.
All key levels
| Level | Price | From now | |
|---|---|---|---|
| Prior week high | PWH | 7,897.50 | +151.00 |
| Prior day high | PDH | 7,879.75 | +133.25 |
| Prior day midpoint | PD EQ | 7,810.50 | +64.00 |
| Overnight high | ONH | 7,769.50 | +23.00 |
| Prior day close | PDC | 7,765.25 | +18.75 |
| Prior week low | PWL | 7,760.25 | +13.75 |
| Asia high | Asia H | 7,755.25 | +8.75 |
| London high | London H | 7,752.25 | +5.75 |
| Prior day low | PDL | 7,741.00 | -5.50 |
| London low | London L | 7,730.50 | -16.00 |
| Asia low | Asia L | 7,729.50 | -17.00 |
| Overnight low | ONL | 7,728.75 | -17.75 |
Gold premarket analysis (GCZ6)
Daily bias: Bearish
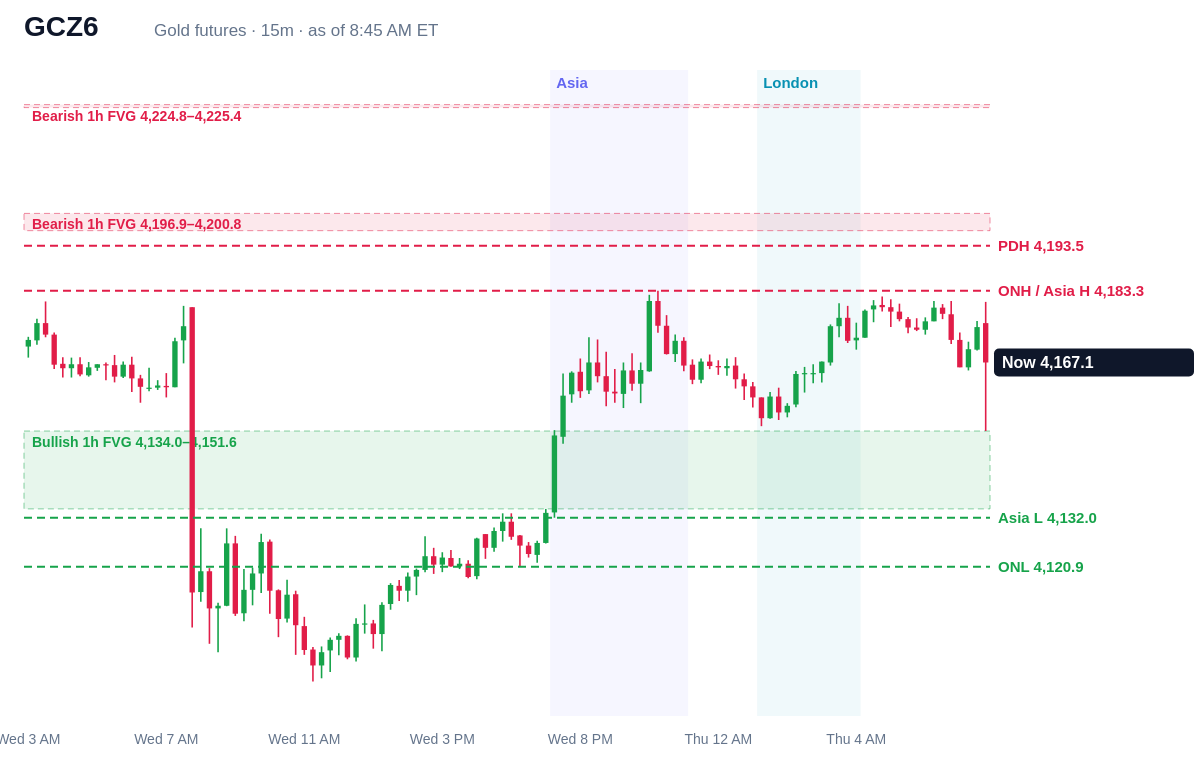
Bias leans bearish: yesterday closed below the prior day low, near the low of its range; the overnight is trading above yesterday's close. The nearest draw on liquidity in that direction is 4,132.0, the Asia low.
Wednesday's session
Gold opened Wednesday at 4,184.2, traded 4,095.0–4,193.5 (a 98.5 point range, wider than the 5-day average of 67.6) and closed at 4,127.3, -56.6 on the day and 33% of the way up its range. The regular session ran 4,095.0–4,179.9.
Overnight session
The overnight has traded 4,120.9–4,183.3 and is at 4,167.1 as of 8:45 AM ET. Asia ranged 4,132.0–4,183.3 and London 4,152.7–4,180.5.
Liquidity
Buy-side (above): 4,183.3 (overnight high / Asia high), 4,193.5 (prior day high).
Sell-side (below): 4,132.0 (Asia low), 4,120.9 (overnight low), 4,095.0 (prior day low), 4,091.2 (prior week low).
Gaps and key zones
- Bearish 1h FVG 4,196.9–4,200.8 (formed Tue 9 AM) above price
- Bearish 1h FVG 4,224.8–4,225.4 (formed Mon 12 AM) above price
- Bullish 1h FVG 4,134.0–4,151.6 (formed Wed 8 PM) below price
- Bullish 1h FVG 4,112.4–4,114.5 (formed Wed 2 PM) below price
Reversal areas to watch
- Short reversal area: 4,183.3 to 4,196.9, where the overnight high (also the Asia high) is just under a bearish 1 hour gap. A failed sweep there is the short setup to watch.
- Short reversal area: 4,193.5 to 4,196.9, where the prior day high is just under a bearish 1 hour gap. A failed sweep there is the short setup to watch.
All key levels
| Level | Price | From now | |
|---|---|---|---|
| Prior week high | PWH | 4,233.7 | +66.6 |
| Prior day high | PDH | 4,193.5 | +26.4 |
| Overnight high | ONH | 4,183.3 | +16.2 |
| Asia high | Asia H | 4,183.3 | +16.2 |
| London high | London H | 4,180.5 | +13.4 |
| London low | London L | 4,152.7 | -14.4 |
| Prior day midpoint | PD EQ | 4,144.2 | -22.9 |
| Asia low | Asia L | 4,132.0 | -35.1 |
| Prior day close | PDC | 4,127.3 | -39.8 |
| Overnight low | ONL | 4,120.9 | -46.2 |
| Prior day low | PDL | 4,095.0 | -72.1 |
| Prior week low | PWL | 4,091.2 | -75.9 |
Get alerted when price reaches these zones
Free ICT alerts for NQ and ES: FVGs, inverse FVGs, sweeps, CISD and more, sent the moment the candle closes.
Set up free ICT alertsFAQ
What is buy-side and sell-side liquidity?
Buy-side liquidity is the stop and breakout orders resting above old highs, such as the prior day high or the overnight high. Sell-side liquidity rests below old lows. Price often runs to these levels before it reverses or continues.
How is the daily bias worked out?
It is a rule-based score, not a forecast: where yesterday closed against the prior day's range, where it closed inside its own range, where the overnight is trading against yesterday's close, and whether the overnight swept yesterday's high or low and came back inside.
What is a fair value gap (FVG)?
A three-candle imbalance where the first and third candles do not overlap. An unfilled 1 hour FVG is a zone price often comes back to. A bullish FVG tends to act as support and a bearish FVG as resistance.
What is a reversal area?
A place where resting liquidity sits right next to an opposing unfilled gap, for example an old high just under a bearish FVG. If price sweeps the high into the gap and rejects, that is the reversal to watch for.
Video transcript
Premarket game plan for Thursday, October 15: N Q, E S & Gold. Key levels, bias and liquidity. N Q. Bias leans bearish: yesterday closed below the prior day low, near the low of its range; the overnight is trading below yesterday's close. Buy-side liquidity: the London high at 29,941. Sell-side: the overnight low at 29,711. Reversal area: 29,941 to 30,036, where the London high is just under a bearish 1 hour gap. A failed sweep there is the short setup to watch. E S. Bias leans bearish: yesterday closed below the prior day low, near the low of its range; the overnight is trading below yesterday's close and swept the prior day low and came back inside. Buy-side liquidity: the overnight high at 7,770. Sell-side: the overnight low at 7,729. Reversal area: 7,770 to 7,785, where the overnight high is just under a bearish 1 hour gap. A failed sweep there is the short setup to watch. Gold. Bias leans bearish: yesterday closed below the prior day low, near the low of its range; the overnight is trading above yesterday's close. Buy-side liquidity: the overnight high (also the Asia high) at 4,183. Sell-side: the Asia low at 4,132. Reversal area: 4,183 to 4,197, where the overnight high (also the Asia high) is just under a bearish 1 hour gap. A failed sweep there is the short setup to watch. Get these levels every morning on Signal Trade App, plus free ICT alerts. Link in bio.
Levels are computed mechanically from real CME futures prices; the bias is a rule-based read of the prior day and overnight, not a prediction. Not financial advice. Futures trading carries substantial risk of loss.