Standard Deviation Trading: Using Volatility Bands for Futures Entries
Category: Strategy | Date: 2026-05-06
What Is Standard Deviation in Trading?
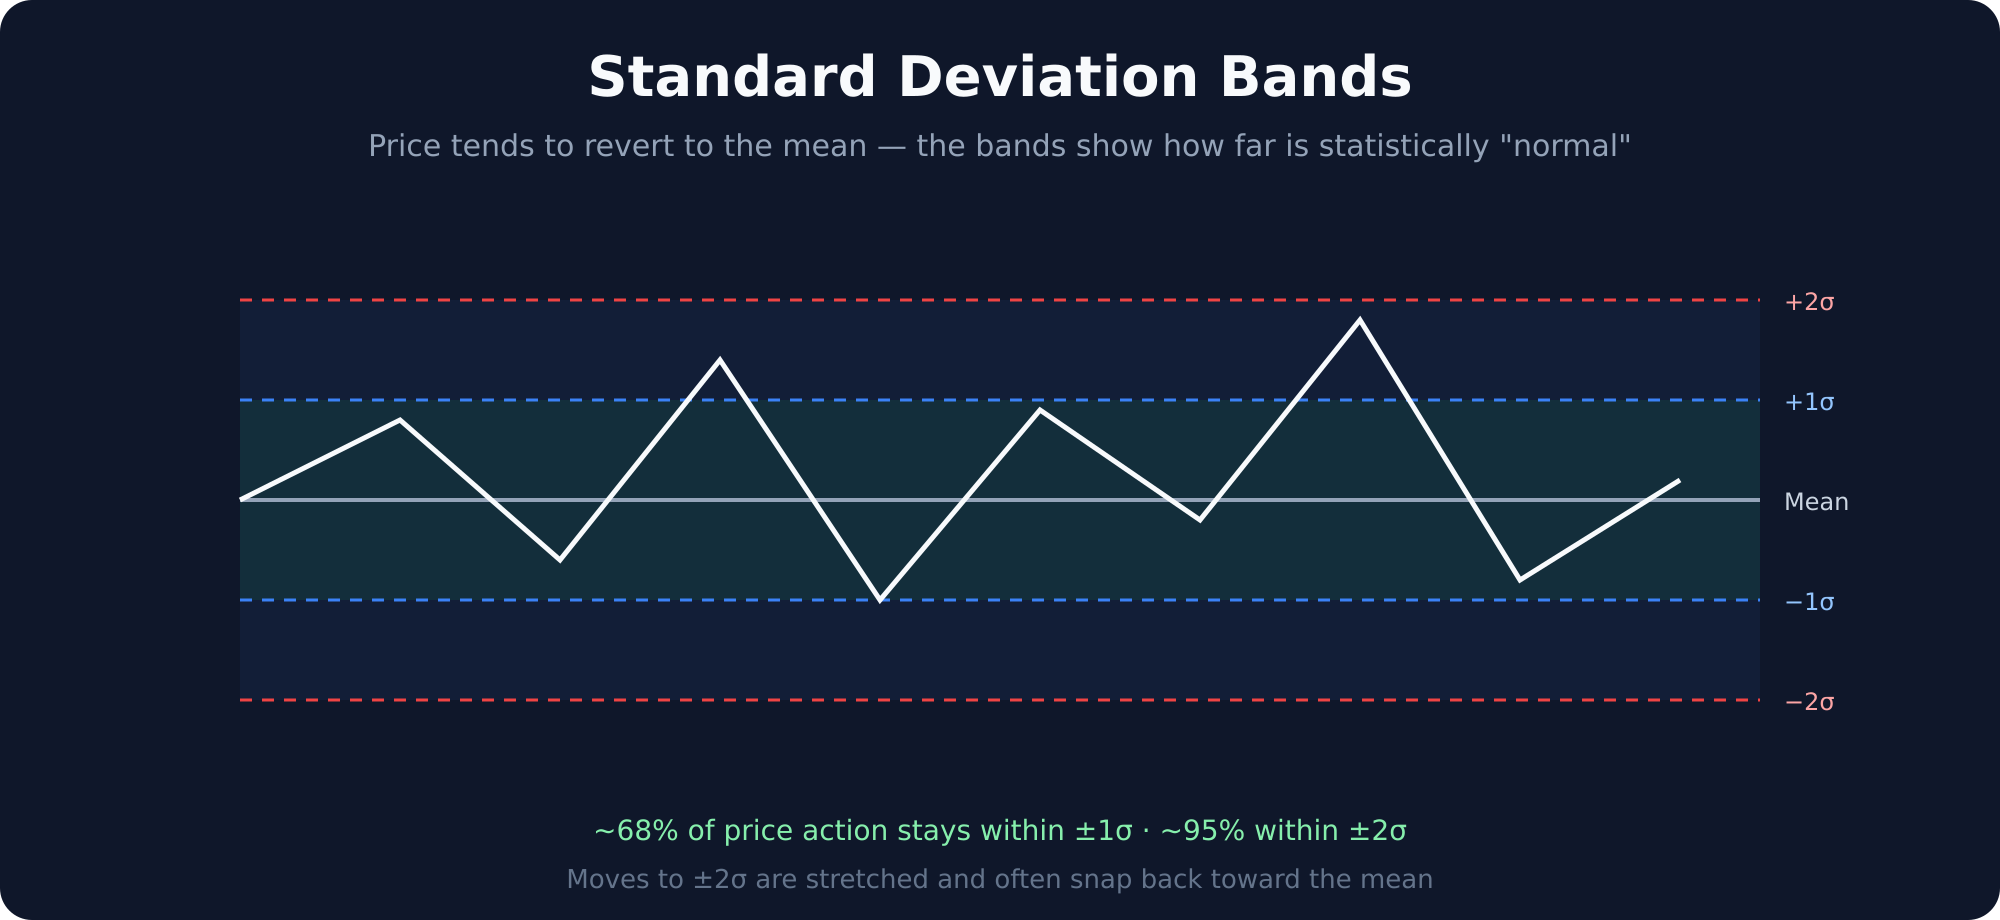
Standard deviation measures how far price typically moves away from its average. In futures trading, it is one of the most powerful tools for understanding volatility, identifying overbought and oversold conditions, and timing entries with statistical edge.
When NQ is trading at 20,000 with a 20-period standard deviation of 50 points, you know that approximately 68% of price action stays within a 50-point band around the mean, 95% stays within 100 points, and 99.7% stays within 150 points. These bands become your roadmap for entries, stops, and targets.
Bollinger Bands and Standard Deviation
Bollinger Bands are the most common visual representation of standard deviation in trading. The middle band is a 20-period simple moving average. The upper and lower bands are plotted two standard deviations above and below the mean. When price touches the upper band, the market is statistically extended. When it touches the lower band, it is statistically compressed.
But Bollinger Bands tell only part of the story. Standard deviation itself — plotted as a standalone indicator — reveals whether volatility is expanding or contracting. Rising STDV means the market is becoming more volatile and directional. Falling STDV means the market is coiling, often before a significant breakout.
STDV Channels for Futures
Advanced futures traders build custom STDV channels instead of relying solely on Bollinger Bands. A 3-sigma channel plots three standard deviations above and below a VWAP or volume-weighted mean. On the MNQ 5-minute chart, price rarely touches the 3-sigma band — and when it does, the mean reversion probability exceeds 80%.
The strategy is mechanical:
- Calculate the VWAP from the session open.
- Plot 1-sigma, 2-sigma, and 3-sigma bands above and below the VWAP.
- Wait for price to reach the 2-sigma or 3-sigma band.
- Enter a mean reversion trade with a stop 1 ATR beyond the band and a target back at the VWAP.
- Only trade in the direction of the higher timeframe trend — if the 1-hour chart is bullish, only take longs at the lower bands.
1-Sigma, 2-Sigma, and 3-Sigma Setups
Each standard deviation level serves a different purpose in futures trading:
- 1-sigma (68% probability): Minor extension — useful for scaling into existing positions, not for new entries.
- 2-sigma (95% probability): Significant extension — ideal for mean reversion entries with 2:1 risk-reward.
- 3-sigma (99.7% probability): Extreme extension — rare but high-confluence. Often coincides with ICT liquidity sweeps and order blocks.
On May 5, 2026, NQ tagged its 3-sigma upper band at 10:15 AM ET during the London-New York overlap. Price had rallied 180 points in 45 minutes — a 3.2-sigma move. Traders who shorted the 3-sigma band with a 10-tick stop captured a 120-point retracement to the VWAP in under 30 minutes.
Mean Reversion vs Trend Following with STDV
Standard deviation works for both strategies, but the rules are opposite:
Mean Reversion
Trade the bands. Buy the lower 2-sigma band in an uptrend. Sell the upper 2-sigma band in a downtrend. This works best during range-bound sessions — the first two hours after the New York open and the last hour before the close.
Trend Following
Trade the breakout of compression. When STDV drops below its 20-period average, the market is coiling. A breakout above the upper 1-sigma band in the direction of the trend often signals the start of an impulsive leg. This works best during trending sessions — post-FOMC, during earnings season, or after a major economic data release.
STDV on NQ, ES, and MNQ
Volatility characteristics differ across futures contracts, which changes how you use standard deviation:
- NQ: High volatility, wide bands. 2-sigma = 60–80 points. Mean reversion trades need 15–20 tick stops.
- ES: Moderate volatility, tighter bands. 2-sigma = 15–25 points. Mean reversion trades need 6–10 tick stops.
- MNQ: Same volatility as NQ but micro-sized. 2-sigma = 60–80 points. Perfect for practicing STDV strategies with minimal capital at risk.
Regardless of the instrument, always normalize your position size by the band width. A 2-sigma NQ trade with a 20-tick stop should risk the same dollar amount as a 2-sigma ES trade with a 10-tick stop. Signal Trade App's copy ratio system handles this automatically — set your leader account's risk in dollars, and each follower scales its contract count to match.
Using STDV with Copy Trading
Standard deviation trading generates precise entry and exit levels — but manually calculating bands and placing orders across five prop firm accounts is impractical. Signal Trade App bridges the gap:
- Connect your accounts from Topstep, Apex, and Take Profit Trader.
- Set up a single copy group with your main account as the leader.
- When your STDV setup triggers, place the bracket order on the leader.
- Signal Trade App copies the entry, stop, and target to all followers within 500ms — including the exact tick distances calculated from your STDV bands.
For affiliates, STDV trading content performs exceptionally well on YouTube and TikTok. A 60-second video showing a 3-sigma NQ rejection with a live copy group dashboard in the background converts viewers at 3–5x the rate of generic trading content. Every subscriber who signs up through your referral link and upgrades to Pro generates $4.90/month in passive recurring income.
Standard deviation does not predict direction — it predicts probability. Trade where probability is on your side, and let the math compound over hundreds of futures trades.
Start Copy Trading Free
Signal Trade App lets you copy one trade across unlimited prop firm accounts in under 500ms. Sign up free with a 5-day Pro trial (credit card required, no charge during trial).
Related Reading
- Help Center — Setup guides, broker connections, and risk management
- Supported Platforms — Tradovate, NinjaTrader, TradingView, and more
- Blog — More guides on copy trading, prop firms, and futures automation